Release Overview: March 2021
Aunalytics is excited to announce the March 2021 Daybreak release to our clients. This release will provide clients with model and site enhancement information along with any fixes to existing functionality we have included.
Daybreak
Natural Language Answers
Daybreak exists to provide answers to the questions users of all backgrounds have about their organizations' data. Now, thanks to months of research and development, Aunalytics is excited to debut a new tool that puts data within the reach of everyone: natural language answers. Natural language answers is a machine learning service that enable users to interact with their industry intelligent datamarts by simply asking questions.
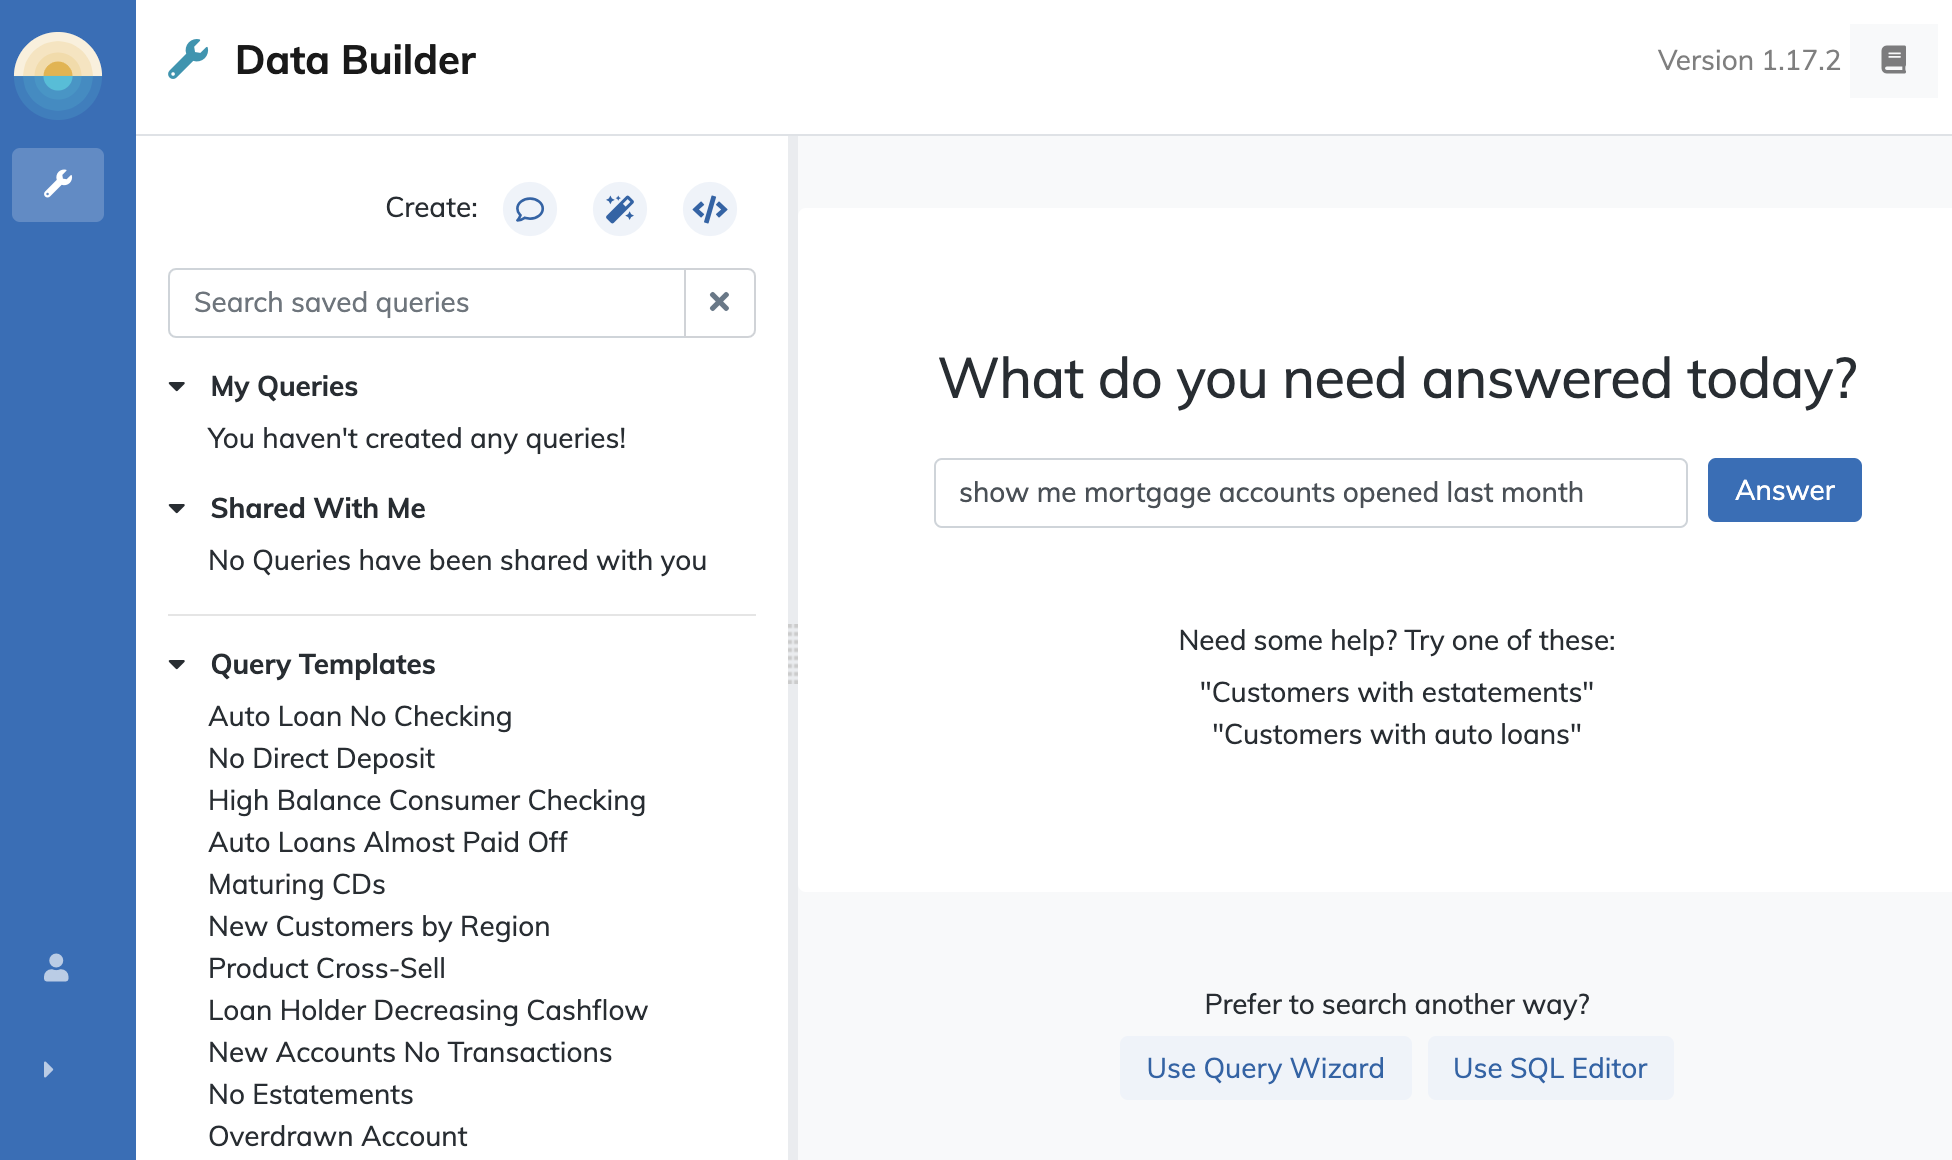
Natural language answers integrates into the Daybreak web app to provide users a way to get answers from their datamarts as easily as typing a question in the Google search bar. Behind the scenes, Aunalytics' proprietary NL2SQL technology translates these questions into structured queries to deliver datasets that respond to questions a user might ask.
Aunalytics' Innovation Lab data scientists have created a machine learning algorithm to understand the questions people ask about their data in a particular focus industry so that it can translate those requests into structured queries suitable for running against a SQL-compliant datamart.
Thanks to these efforts, our clients using Daybreak for the financial services industry can now begin the day with answers by asking Daybreak questions like "give me a list of mortgages opened last quarter" or "Show me CD accounts with a maturity date in the next month."
Learn more about this exciting new feature and how to use it here.
Insights
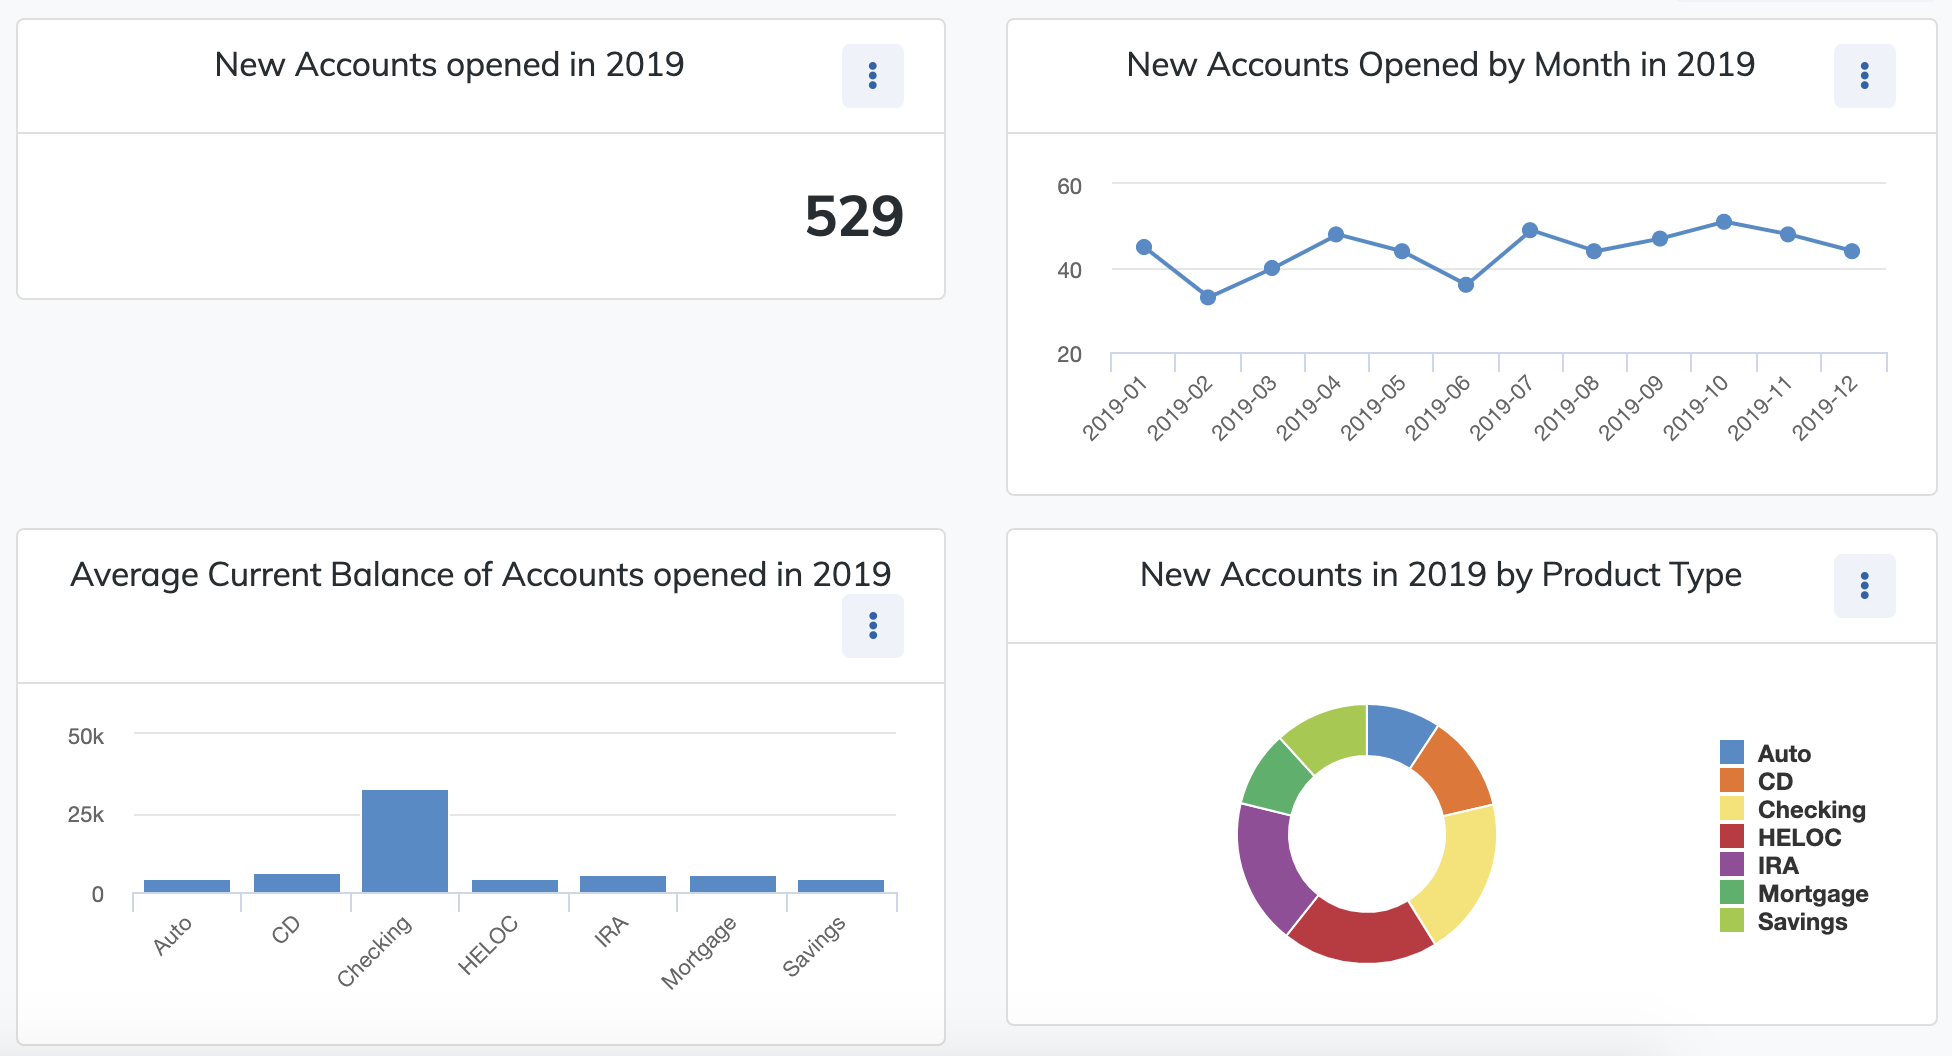
Daybreak Insights provide a new way to extract value from data by allowing the creation of dashboards of visualizations from the results of their datamart queries. With this release, users will be able to access the "Insights" tab in the Data Builder's results area (at the bottom of the Data Builder tool). The Insight's tab provides a dashboard where users can create, save, and share charts of their query's results.
Currently, four types of visualizations are supported: numerical summaries, column charts for data points grouped by category, line charts for data points grouped by time interval, and donut charts to show proportional distribution by category.
Learn more about Insights and start creating them today here.